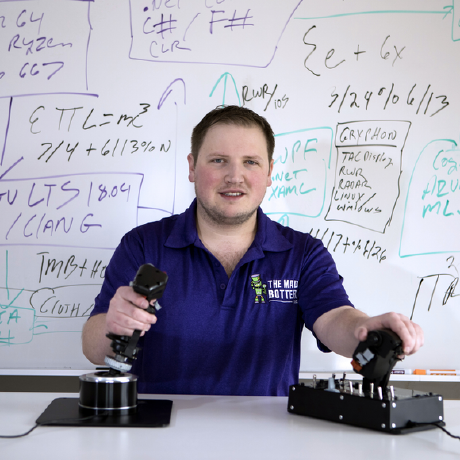
My workbench currently looks like a crime scene at an automation distributor. Right between a half-empty mug of cold coffee and a logic analyzer sits a BeagleBone Green Eco, wired up to a 24V DIN-rail supply, a K-type thermocouple amplifier, and a 4-20 mA pressure transmitter that I have been abusing with a hand pump all week. If you caught our recent conversations on Coder Radio or read my previous posts here about pairing Rust with the Revolution Pi on the shop floor, you already know I have been spending a lot of time lately rejecting fragile consumer hardware in favor of proper industrial edge compute.
Moving on from the hardware religion for a moment, the real reason this Green Eco is sitting on my bench is to solve a business problem that has nothing to do with soldering irons or Linux kernels. It is about what happens six months after a part leaves your building.
Getting a number off a sensor is not hard. That takes an afternoon. Any junior engineer can spend a Saturday duct-taping consumer Raspberry Pis into dusty switch cabinets, piping MQTT messages into a time-series database, and throwing up a Grafana dashboard by Monday morning. Everyone claps. The needles move.
Then six months pass. A customer calls about a failed hydraulic manifold, or an auditor walks in and asks about a curing oven cycle from April. Suddenly, nobody in the plant can prove what the pressure or temperature actually was during that run. You cannot prove when the sample was truly observed, whether the thermocouple was healthy or open-circuit at the time, or which work order the machine was actually running when the spike happened.
That gap is the difference between telemetry and evidence. Telemetry tells you what is happening right now so you can squint at a monitor. Evidence is a record you can defend when someone across a conference table is trying to blame your shop for a failure. Closing that exact gap is what we do at The Mad Botter.
Why the BeagleBone Green Eco Belongs in the Cabinet
Before we get into how the data model works, let’s look at one my favorite boxes we put on the machine. The BeagleBone Green Eco, built by Seeed Studio in partnership with BeagleBoard.org, is built around the Texas Instruments AM62x processor. That gives you a quad-core ARM Cortex-A53 running standard Debian Linux alongside TI’s PRU-ICSS real-time cores, plus gigabit Ethernet, USB-C, Grove connectors, and an industrial temperature range that will not flake out the first time your shop floor hits ninety-five degrees in July. It is a sensible edge box for a manufacturing shop: you get standard Linux where you want Linux, deterministic I/O from the PRUs where you need tight timing, a price point cheap enough to put one per bench or per machine, and open hardware so no vendor can lock you in.
Let’s be completely honest about what it is not, though. The Green Eco is not a PLC, and it does not replace one. In our deployments, the edge device never actuates anything. It does not close relays, it does not command valves, and we make zero safety claims. Interlocks and machine control stay inside your PLC where they belong. The edge device reads, records, and forwards.
Four Clocks and Why Wall Time Lies
The first trap most engineering teams fall into when collecting shop-floor data is trusting a single timestamp. In a real factory, wall time is a polite fiction.
In October 2026, our platform imported a batch of session records from a deployed board that had been sitting on an isolated stand with a dead backup battery and no NTP reachability. According to the board’s internal clock, every single sample had been recorded in August 2025. If your database relies on the device’s wall clock to order events or evaluate alarm windows, a board like that will silently corrupt your history. If your server overwrites the device timestamp with the time the packet arrived over the network, you just destroyed the actual observation cadence.
To treat sensor readings as evidence, the platform The Mad Botter deploys keeps four distinct times separated, and it never uses wall time as the ordering authority:
- Observed Time: When the device clock says the sample was taken, paired explicitly with a clock quality flag (
synced,holdover,unsynced, orsteppedifchronydjust jumped the clock mid-run). - Sequence Number: A strictly monotonically increasing integer recorded by the device (
seq 1,seq 2,seq 3). This is the true ordering authority for the session. Even if the device clock thinks it is August 2025,seq 402always happened afterseq 401. - Received Time: When the server actually ingested the record.
- Decision Time: When a person looked at the record and linked it to a work order, signed off on a review, or cleared an exception.
Our platform never rewrites an observed timestamp to make a chart look pretty. If a board was unsynced, the permanent record shows it was unsynced, ordered strictly by its sequence number, right alongside the exact time the server received it.
Alarms, Sensor Faults, and the Sound of Silence
Once you have ordering straight, you have to stop lumping every abnormal state into a single bucket called “alert.” Alarms are not sensor faults, sensor faults are not disconnections, and disconnections are not recording failures. Conflating them is how shops end up either ignoring real problems or chasing ghosts with a multimeter.
Take a curing oven. A working thermocouple reporting an out-of-range oven is an alarm. The sensor is healthy, and the equipment is out of spec. Now suppose a forklift snags the conduit and yanks the wire loose, creating an open circuit. The thermocouple amplifier sets its fault bit over /dev/spidev0.0. That is a sensor fault, and the last valid value before the fault raises no alarm.
What if the edge board itself goes quiet? A device silent for twenty minutes against a five-minute cadence is rendered literally as not reporting since [timestamp], not “offline” and certainly not “fine.”
Furthermore, sensor silence never proves an alarm has cleared. Suppose a hydraulic pump test stand has a 100 bar high limit with a 5 bar hysteresis, meaning the alarm only clears when pressure drops cleanly to 95 bar or below. The pump spikes to 104 bar. The alarm opens. Two seconds later, someone kicks the Ethernet cable out of the switch, or the 4-20 mA transmitter faults out.
In our platform, that alarm stays open. Silence does not clear an exception. Until the edge device records a healthy sample at or below 95 bar, the system refuses to mark that alarm interval closed.
Capture at the Edge: Append-Only and Hash-Chained
This brings us to the biggest architectural flaw in standard industrial IoT: streaming raw readings over MQTT straight into a time-series database.
If all you want is a dashboard on the wall so the plant manager can see which spindles are turning, MQTT straight into a time-series database is fine. It is not fine for anything someone will have to defend later. Shop networks drop packets, brokers restart, and standard time-series databases let anyone with credentials overwrite history without leaving a trace.
For real evidence, capture has to happen at the edge in an append-only, hash-chained log.
On the Green Eco, our edge daemon reads the sensors via the Linux IIO interface (/sys/bus/iio/devices/iio:device0) or SPI, checks kernel clock state via adjtimex(), and writes each sample to a local write-ahead log with fsync(), sequence numbers, and a cryptographic hash chain. Periodically, the board seals a segment of that log into a checksummed bundle and ships it to the server. When the network exists, it ships over the wire. When it doesn’t, it writes the sealed bundles to a USB stick, because plenty of shops have a press or an oven in the back corner that is not on the network and never will be.
When our platform receives a bundle, it verifies the entire chain before writing a single row:
- It rejects any bundle with even one flipped byte.
- If a technician imports the same bundle twice from a USB stick, the server recognizes it and imports it as one session without duplicating data.
- If a bundle goes missing in transit, the platform does not stitch the graph together and pretend the session was shorter. It records an explicit coverage gap: seq 2,117 to 3,402 not received.
If this is the gap you have been living with in your shop, let’s talk at themadbotter.com. We build and deploy this entire pipeline as a turnkey system so your engineering team does not have to spend the next year learning cryptography and embedded Linux the hard way.
Three Ways Data Gets In, Ranked by Trust
Of course, not every machine on your floor needs or starts with a dedicated edge board. We meet your existing equipment where it is by ranking inbound data into three explicit trust tiers inside our platform:
- Verified Capture Bundles (Highest Assurance): Sealed, hash-chained, sequence-ordered bundles straight from the Green Eco at the edge.
- Acknowledged Segments from a Gateway (Medium Assurance): Buffered batches forwarded by a shop gateway polling your existing PLCs over OPC UA or Modbus.
- Plain Pushed Readings from Legacy Devices (Lowest Assurance): Unbuffered MQTT payloads or HTTP posts from older networked meters. Our platform accepts them so your team has visibility, labels them clearly as lower-assurance records, and never evaluates them for alarms as if the server’s receipt time were the actual observation time.
Identities Are Claims Until a Person Pairs Them
Here is a rule that prevents massive headaches during an audit: a device label on the wire is just a claim, not proof of which machine that box is bolted to. Technicians swap hardware between benches all the time when troubleshooting.
In our platform, identities are claims until a person pairs them. An administrator registers the edge device, issues its credential out of band, and pairs it to an asset as a dated decision. If you move a Green Eco from Hyd-Bench-01 to Oven-03 in November, you record a new pairing decision. Every session captured prior to that date stays permanently attributed to the old machine.
The same applies to work orders. When a technician at the bench scans a traveler barcode reading WO:26-105R0042, the edge device records that string inside the hash chain as an observation. Our platform parses that observation and suggests matching open work orders, but a person makes the final decision to associate the session to the work order. The software suggests; the human decides.
What a Shop Actually Gets
When we deploy our platform in a manufacturing plant or an MRO shop, the daily workflow gets much sharper:
- Inspections That Carry the Evidence: A repair evaluation or final inspection carries the exact bench session with it, including the chain hash, the sequence range, a clear exception summary (
1 alarm interval reviewed, 10 fault episodes reviewed), who reviewed it, and when. - Calibration and Tool-Readiness Evidence: Because hardware pairings are dated records, you can prove immediately whether the pressure transmitter or thermocouple amp on that bench was in calibration when the job ran.
- Honest Freezer and Oven Monitoring: You get continuous cold-storage and curing oven records that are strictly framed as equipment monitoring, not an overblown material-genealogy claim that an auditor can pick apart.
- Dashboards That Tell the Truth: Every equipment tile on our dashboard displays
Last ObservedandLast Receivedas two separate values, and tiles are never rendered green by default.
What This Is Not
Let’s be plain about what we are not selling you. This is not predictive maintenance. It is not “AI.” It is not a regulatory certification in a box, and it is not an electronic-signature product.
Most vendors in this space will promise you magic algorithms that predict bearing failures while automatically satisfying every regulator on earth. They are lying to you. The platform The Mad Botter deploys records tamper-evident equipment evidence and logs human decisions. Your people and your auditors make the determinations. That honesty is why our customers trust us with their shop-floor records.
What the First Thirty Days with The Mad Botter Look Like
You do not need another box of parts sitting on a shelf waiting for someone to find free time to write software for it. When you hire The Mad Botter, we handle the entire deployment as a done-for-you engagement. Your team reviews sessions and makes quality decisions; we build, wire, and maintain the plumbing.
Here is how our first thirty days together actually work:
- Discovery Call and Site Walk: We look at your floor, your network reality (including the dead zones), and how your travelers and work orders actually move through the building.
- Picking the First Machine: Together, we pick the single bench or machine that generates the most customer arguments, scrap headaches, or audit friction.
- Hardware and Platform Deployment: We bring the BeagleBone Green Eco, mount it in the cabinet with proper DIN-rail power, wire in the industrial sensors (such as a thermocouple amplifier or a 4-20 mA transmitter), deploy our platform on your local server or a hosted instance, and pair the hardware.
- First Verified Session Reviewed: Within the first month, your quality lead or shop supervisor is sitting at their desk reviewing the first verified, hash-chained equipment session attached to a real work order.
- Machine-by-Machine Expansion: Once that first workflow is locked in, we roll out across the rest of your benches, ovens, and legacy PLC gateways at a pace that does not disrupt production.
As I wrote in my earlier post on IoT integration, reading a sensor takes an afternoon, but integrating that data into the messy human reality of a machine shop is where ninety percent of the time goes. Moreover, the first month of data off any shop floor is mostly operational noise: doors left open during shift changes, lines bled down during lunch, and operators forgetting to scan travelers. Navigating that noise and fitting the system to your shop’s actual workflow is why manufacturers bring us in rather than trying to cobble it together internally.
Stop relying on fragile dashboards and wall clocks you cannot defend. If you want real equipment evidence attached to your work orders without turning your engineering team into full-time embedded systems maintainers, head over to themadbotter.com and start a conversation with us. I will also be talking more about our latest shop-floor hardware testing on the next episode of Coder Radio, and you can always reach me on LinkedIn.
P.S. Ready to close the gap between telemetry and evidence on your floor? The Mad Botter will put an industrial edge device on your machine, deploy our manufacturing and MRO platform for your team, and hand you verified equipment sessions attached directly to your real work orders. Reach out at themadbotter.com to schedule your discovery call.